Dubai Property Market Report Q3 2025: Summer Resilience & September Recovery
Comprehensive analysis of Dubai real estate market performance in Q3 2025. Transaction volumes, price trends, top-performing areas, and investment opportunities based on Dubai Land Department data.
Key Takeaways
- Dubai recorded 38,500+ property transactions worth AED 132 billion in Q3 2025
- Year-over-year transaction growth of 23%, total value growth of 26%
- September recovery with 18,500+ transactions (strongest month ever for September)
- JVC leads with 2,900+ transactions, Dubai Creek Harbour shows +20% price appreciation
- Average rental yields: 6-9% for apartments, 4-6% for villas
- Top investor nationalities: Indian (19%), British (11%), Pakistani (11%)
TL;DR: Key Findings
Dubai's real estate market showed resilience in Q3 2025 despite traditional summer slowdown. The market experienced the typical July-August slowdown due to peak summer heat and vacation season, but demonstrated strong recovery in September driven by pre-Q4 launch activity and returning investors.
Key Numbers:
- Transaction Volume: 38,500+ transactions in Q3 2025
- Total Value: AED 132 billion in property sales
- Average Price: AED 1,520 per square foot market-wide
- Top Performing Area: Jumeirah Village Circle (JVC) with 2,900+ transactions
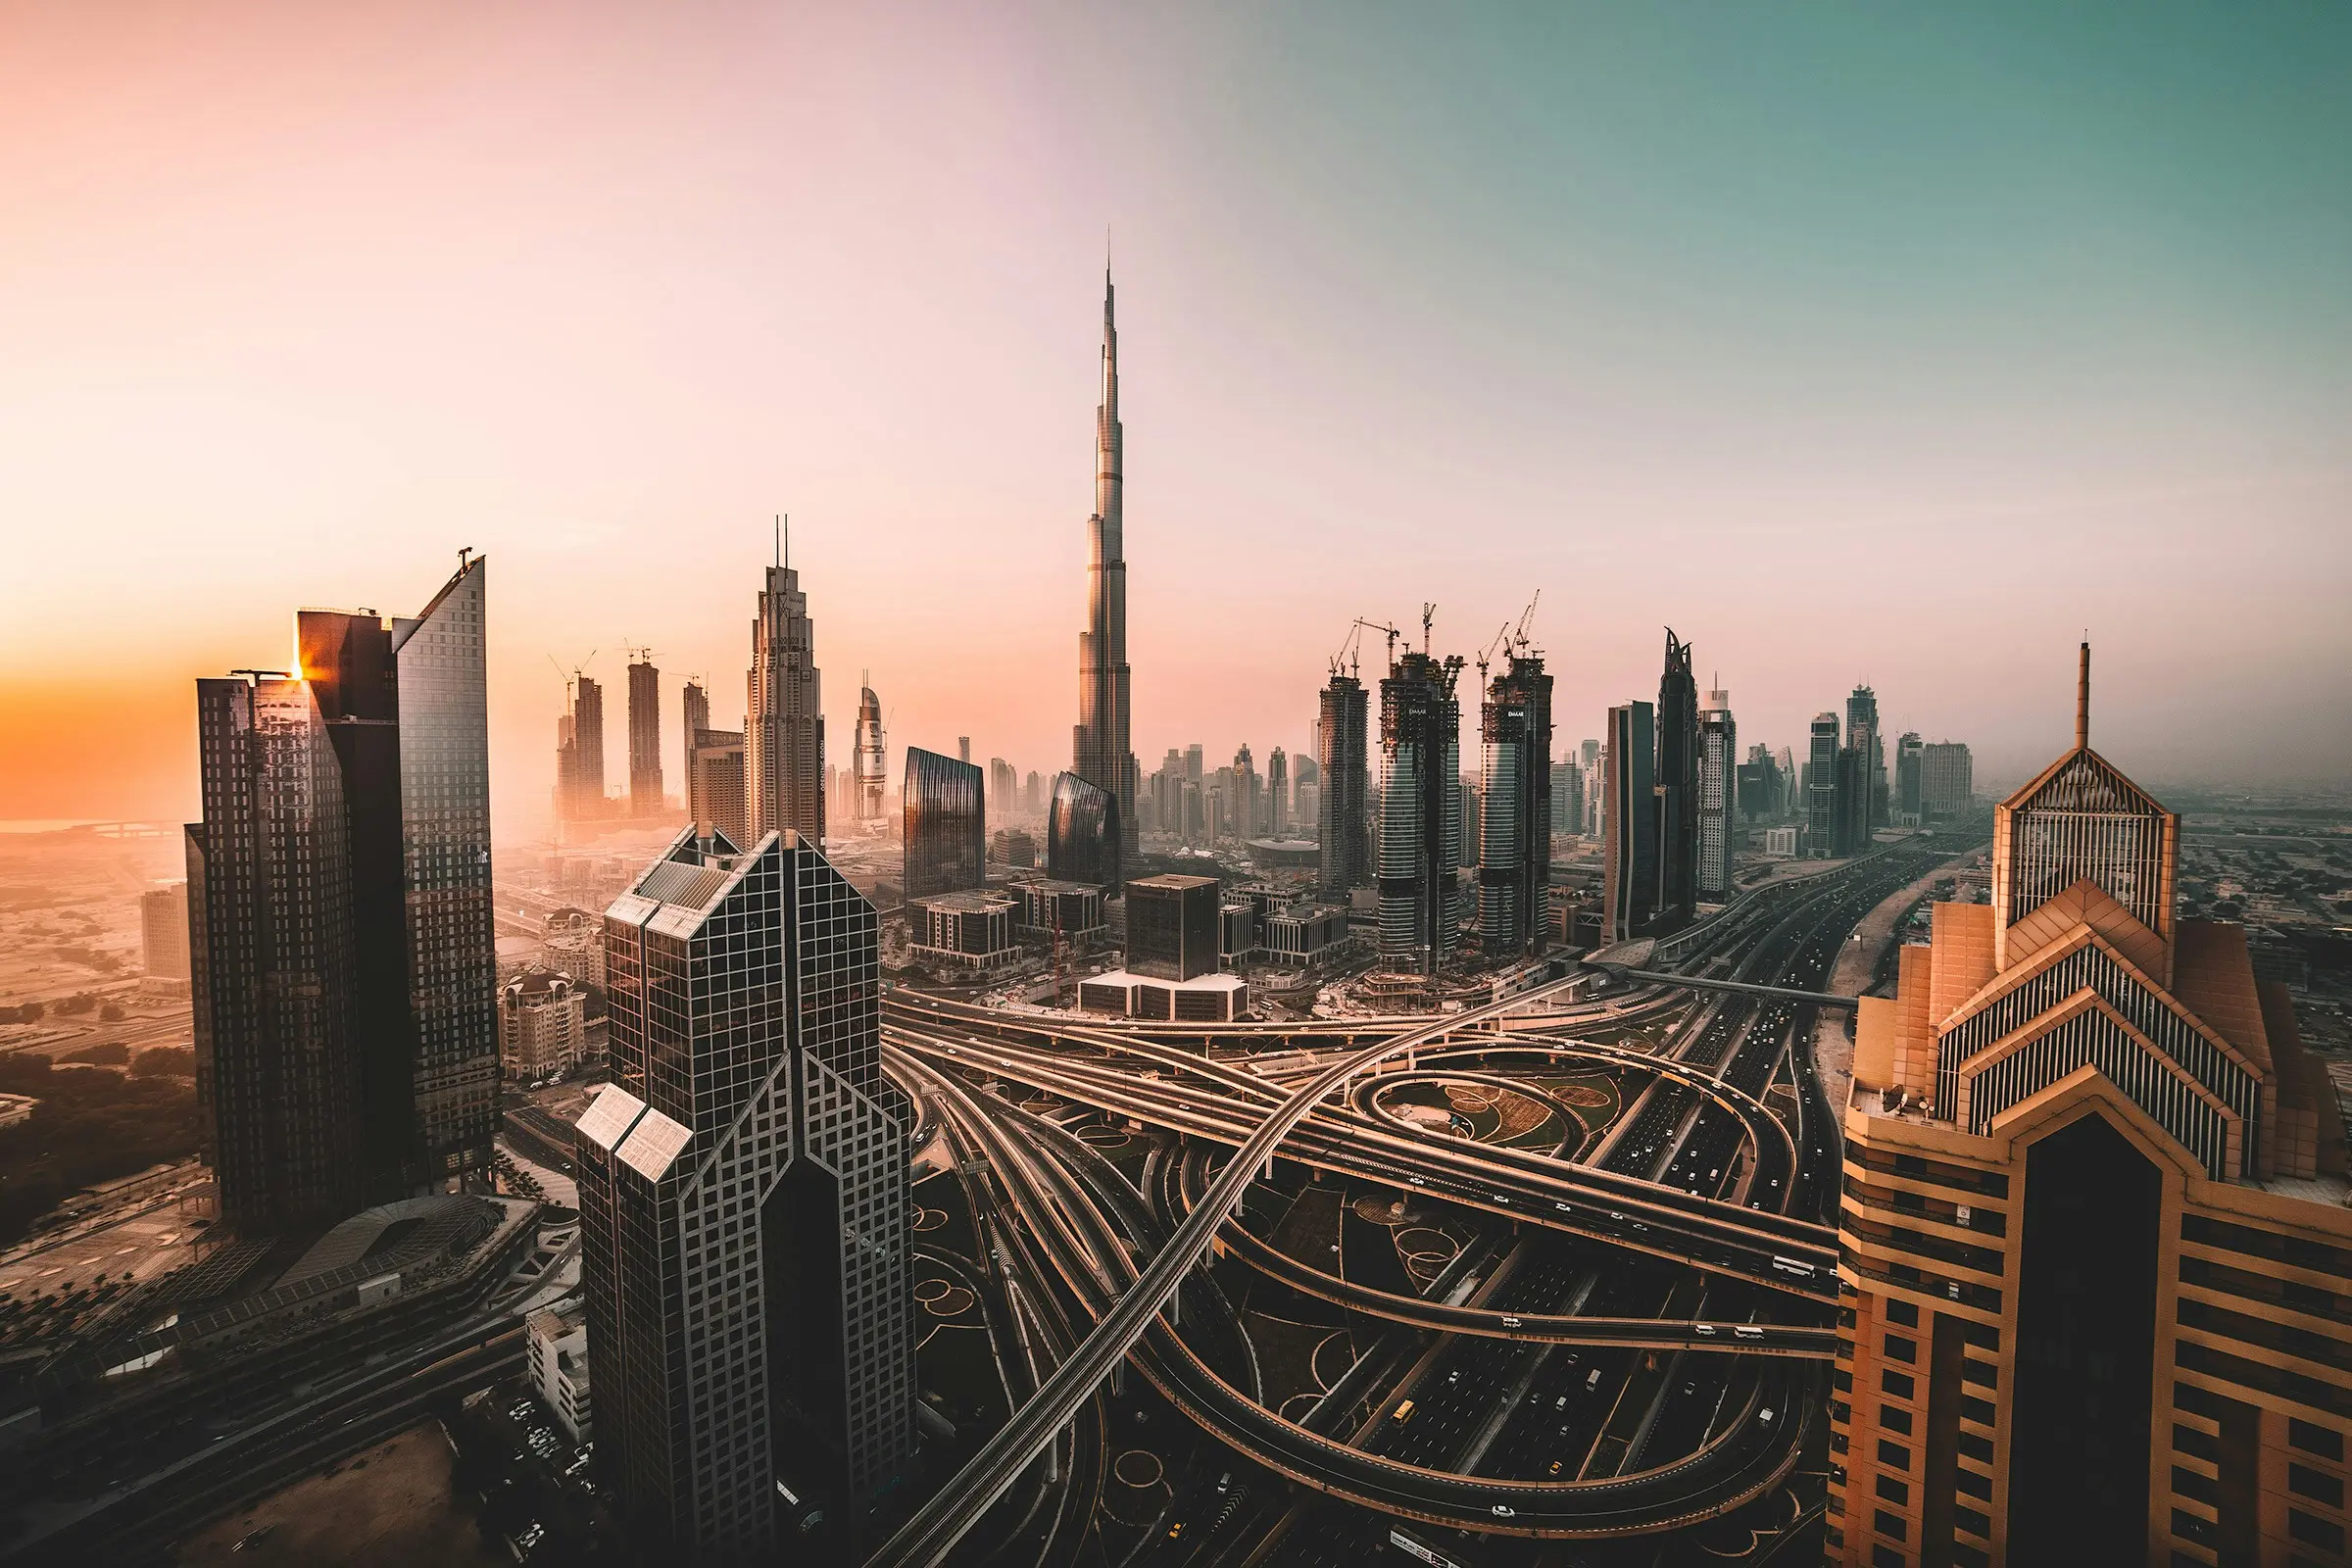
Market Overview
The Dubai real estate market in Q3 2025 demonstrated the market's maturity and resilience. While transaction volumes naturally decreased from Q2's peak due to seasonal factors, the September recovery signaled strong fundamentals heading into Q4 2025.
Seasonal Pattern Analysis
Q3 typically represents the slowest quarter in Dubai's real estate calendar due to:
- Peak summer temperatures (45°C+) limiting property viewings
- Summer vacation period for families
- Reduced working hours in some sectors
However, 2025 showed stronger-than-typical Q3 performance due to:
- Strong investor confidence from H1 results
- Anticipation of Q4 new project launches
- Continued population growth and net migration
Transaction Performance
| Metric | Q3 2025 | Q3 2024 | Change |
|---|---|---|---|
| Total Transactions | 38,500+ | 31,200 | +23% |
| Total Volume (AED) | 132B | 105B | +26% |
| Off-Plan Share | 56% | 60% | -4% |
| Ready Property Share | 44% | 40% | +4% |
According to Dubai Land Department data, Q3 2025 maintained strong year-over-year growth despite the seasonal slowdown, with total transaction value growing 26% compared to Q3 2024.
Top Performing Areas Q3 2025
By Transaction Volume
| Rank | Area | Transactions | Avg Price/sqft | YoY Change |
|---|---|---|---|---|
| 1 | Jumeirah Village Circle (JVC) | 2,900+ | AED 980 | +16% |
| 2 | Business Bay | 2,500+ | AED 1,700 | +13% |
| 3 | Dubai Marina | 2,200+ | AED 1,900 | +11% |
| 4 | Downtown Dubai | 1,900+ | AED 2,480 | +9% |
| 5 | Dubai Hills Estate | 1,700+ | AED 1,620 | +19% |
| 6 | Palm Jumeirah | 1,300+ | AED 2,950 | +15% |
| 7 | Dubai Creek Harbour | 1,100+ | AED 1,880 | +20% |
| 8 | Jumeirah Lake Towers (JLT) | 1,000+ | AED 1,250 | +10% |
Price Appreciation Leaders
- Dubai Creek Harbour - +20% (Creek Tower construction progress, new mall opening)
- Dubai Hills Estate - +19% (Mature community, new retail outlets)
- JVC - +16% (Affordable entry point, high rental yields)
- Palm Jumeirah - +15% (Luxury demand, limited supply, hotel expansion)
- Business Bay - +13% (Central location, Metro connectivity, new offices)
Monthly Trend Analysis
| Month | Transactions | Key Drivers |
|---|---|---|
| July | 10,200 | Summer slowdown, vacation period |
| August | 9,800 | Continued seasonal low |
| September | 18,500+ | Q4 launch anticipation, back-to-school, investor return |
September showed exceptional recovery with nearly double the transactions of July-August, confirming the market's fundamental strength.
Investment Analysis by Property Type
Apartments
| Unit Type | Avg Price Range | Avg Rental Yield | Best Areas |
|---|---|---|---|
| Studio | AED 520K - 950K | 7-9% | JVC, JLT, Dubai South |
| 1 Bedroom | AED 850K - 1.6M | 6-8% | Marina, Business Bay, Creek |
| 2 Bedroom | AED 1.4M - 2.7M | 5-7% | Downtown, Marina, Hills |
| 3 Bedroom | AED 2.2M - 4.5M | 4-6% | Palm, Downtown, Creek |
Villas & Townhouses
| Type | Avg Price Range | Avg Rental Yield | Best Communities |
|---|---|---|---|
| Townhouse | AED 1.6M - 3.2M | 5-6% | JVC, Dubai Hills, Arabian Ranches 3 |
| Villa 3-4BR | AED 3.2M - 6.5M | 4-5% | Palm, Emirates Hills, Dubai Hills |
| Villa 5+BR | AED 6.5M - 22M+ | 3-4% | Palm, Emirates Hills, Al Barari |
Off-Plan vs Ready Property Analysis
Off-Plan Market (56% of transactions)
Off-plan properties remain the majority of transactions, though the share decreased slightly as buyers sought immediate rental income during the summer months.
Top Off-Plan Areas Q3 2025:
- Dubai Creek Harbour - Emaar projects, Creek Tower proximity
- Dubai South - Affordable entry point, Expo legacy
- JVC - High yield potential, new community amenities
- Business Bay - Premium location, office conversions
Ready Property Market (44% of transactions)
Ready properties gained share in Q3 as investors sought:
- Immediate rental income during peak summer tourist season
- No construction risk amid economic uncertainty
- Ability to inspect before purchase
- Quick move-in for families before school year
Top Ready Property Areas:
- Dubai Marina - Mature community, 90%+ occupancy, tourist season
- Downtown Dubai - Premium rental rates, corporate housing demand
- JLT - Affordable with Metro access, stable tenant base
- Palm Jumeirah - Luxury waterfront, holiday rental demand
Rental Market Update
| Area | Studio Yield | 1BR Yield | 2BR Yield |
|---|---|---|---|
| JVC | 8-9% | 7-8% | 6-7% |
| JLT | 7-8% | 6-7% | 5-6% |
| Marina | 7-8% | 6-7% | 5-6% |
| Business Bay | 6-7% | 5-6% | 5-6% |
| Downtown | 5-6% | 5-6% | 4-5% |
| Palm | 4-5% | 4-5% | 4-5% |
Key Rental Trends
- Short-term rentals: Peak demand in July-August in tourist areas (Marina, Palm, Downtown)
- Long-term rentals: Stable demand in family areas (JVC, Dubai Hills, Arabian Ranches)
- Annual rent increases: 12-18% on renewals in prime areas
- Furnished apartments: Growing demand for furnished units in Marina and Downtown
Foreign Investor Activity
Top Investor Nationalities
- Indian - 19% of foreign transactions
- British - 11%
- Pakistani - 11%
- Russian - 8%
- Chinese - 8%
Golden Visa Impact
The UAE Golden Visa program continues to drive investment:
- AED 2M+ property investment qualifies
- 10-year renewable residency
- Family sponsorship included
- No minimum stay requirement
Market Outlook for Q4 2025 and Beyond
Positive Factors
- Q4 Launch Season - Major developers typically launch new projects in Q4
- Interest Rate Environment - Potential rate cuts could boost buyer activity
- Population Growth - Continued net migration driving demand
- Tourism Recovery - Strong summer tourism numbers
Watch Points
- Supply Pipeline - 40,000+ units expected in 2025-2026
- Global Economic Conditions - Economic uncertainty in key markets
- Affordability Concerns - Rising prices may push buyers to emerging areas
Price Forecast
| Period | Expected Change | Key Drivers |
|---|---|---|
| Q4 2025 | +4-6% | Seasonal peak, new launches |
| Q1 2026 | +3-5% | Post-New Year activity |
| H1 2026 | +6-10% | Infrastructure, population growth |
Investment Recommendations
For First-Time Buyers
- Best Entry Point: JVC studios (AED 520K-750K, 8-9% yield)
- Alternative: Dubai South apartments (AED 580K+ starting)
- Strategy: Buy ready for immediate rental income, or off-plan for capital appreciation
For Yield Investors
- Best Yields: JVC, JLT, Dubai Sports City (7-9% gross)
- Strategy: Focus on studios and 1-bedrooms near Metro
For Capital Appreciation
- Best Potential: Dubai Creek Harbour, Dubai Hills Estate
- Strategy: Buy off-plan at launch, sell at/near completion
For Luxury Buyers
- Best Value: Palm Jumeirah, Downtown Dubai
- Strategy: Focus on unique units (penthouse, sea view, corner units)
Conclusion
The Dubai real estate market in Q3 2025 demonstrated resilience amid seasonal challenges. Key highlights include:
- 23% YoY transaction growth to 38,500+ deals
- AED 132 billion in total transaction value
- September recovery with 18,500+ transactions (strongest month)
- JVC leads in transaction volume with 2,900+ deals
- Dubai Creek Harbour shows highest appreciation at +20%
- Rental yields remain attractive at 6-9% for apartments
Ready to invest? Chat with Genie AI for personalized property recommendations.
Related Area Guides
- JVC Investment Guide - Dubai's highest transaction volume area
- Business Bay Investment Guide - Downtown's neighbor
- Dubai Marina Investment Guide - Premier waterfront community
- Downtown Dubai Investment Guide - Prestigious address
- Palm Jumeirah Investment Guide - Ultra-luxury waterfront
- Dubai Creek Harbour Guide - Emerging opportunity
Frequently Asked Questions
How many property transactions were recorded in Dubai in Q3 2025?
Dubai recorded over 38,500 property transactions worth AED 132 billion in Q3 2025, representing a 23% increase in volume and 26% increase in value compared to Q3 2024, according to Dubai Land Department data.
Which Dubai area had the most property transactions in Q3 2025?
Jumeirah Village Circle (JVC) led with 2,900+ transactions in Q3 2025, followed by Business Bay (2,500+), Dubai Marina (2,200+), and Downtown Dubai (1,900+).
What is the average property price per square foot in Dubai Q3 2025?
The average property price in Dubai is approximately AED 1,520 per square foot market-wide in Q3 2025. Prices vary by area: JVC AED 980/sqft, Dubai Marina AED 1,900/sqft, Downtown Dubai AED 2,480/sqft.
Which Dubai areas showed the highest price appreciation in Q3 2025?
Dubai Creek Harbour led with +20% year-over-year price appreciation, followed by Dubai Hills Estate (+19%), JVC (+16%), Palm Jumeirah (+15%), and Business Bay (+13%).
What are the rental yields in Dubai in Q3 2025?
Dubai rental yields remain among the highest globally: studios yield 7-9%, 1-bedroom apartments yield 6-8%, 2-bedrooms yield 5-7%, and villas yield 4-6%.
How did the summer slowdown affect Dubai property market in Q3 2025?
Q3 traditionally sees lower activity due to summer heat and vacations. July and August recorded approximately 10,000 and 9,800 transactions respectively. However, September showed exceptional recovery with 18,500+ transactions, nearly double the monthly average.
Editorial Team
AiGentsRealtyThe AiGentsRealty editorial team consists of real estate experts, market analysts, and property consultants with over 20 years of combined experience in the Dubai real estate market.
Related Articles
Why Dubai Remains Untouched: Geopolitics and Property Investment
Understand the structural disconnect between regional geopolitical noise and the continuous growth of Dubai's property investment market in 2026.
Market NewsHow the UAE's Neutrality is Fueling Dubai's Property Market Boom
Analyze how the UAE's strategic diplomatic neutrality in 2026 is directly translating into a massive boom for Dubai's commercial and residential property markets.
Market NewsDubai Real Estate: The Ultimate Safe Haven Amidst 2026 Middle East Tensions
Discover why global investors are choosing Dubai real estate as their primary safe haven strategy to protect capital during the 2026 regional tensions.
Ready to Invest in Dubai?
Get personalized investment recommendations from our AI advisor based on your budget, goals, and preferences.
Ask Genie AI